Bar Graphs
A Bar Graphs interaction displays a bar graph, typically one that the student can edit. Depending on how you render the graph, it may be used as a histogram or a dot plot, as described in Creating Specific Graph Types.
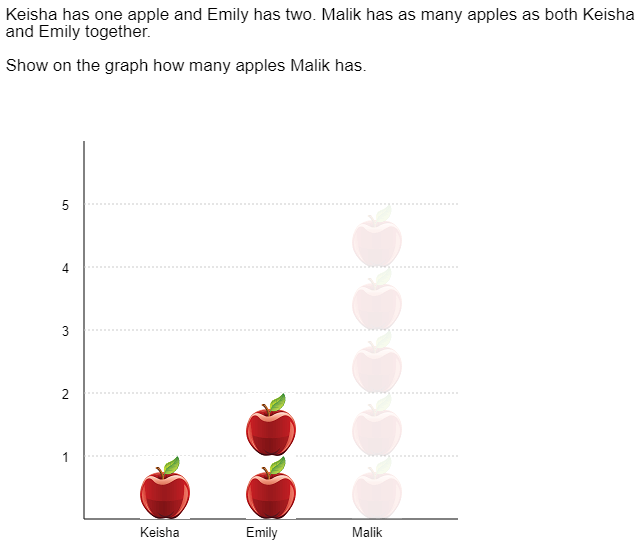
Figure 65: Graph Interaction: Bar Graphs